
Forex support and resistance levels are the foundation of any good trading strategy. Whether you’re trading a simple price action strategy or something more complex, these levels form the road map to trading success.
Although the topic of support and resistance is arguably the most common among Forex traders, it is also perhaps one of the more misunderstood. It seems that most Forex traders falls into one of two categories when it comes to drawing support and resistance levels:
- Those who draw too many levels
- Those who don’t draw enough levels
But let me be clear. Drawing the “correct” support and resistance levels on a chart is one of the more discretionary aspects of trading Forex. Therefore it isn’t a surprise that many traders struggle in this area.
Because it’s more discretionary, we can think of drawing support and resistance as a combination of an art and a science. So while there is a preferred way to go about drawing these levels, it isn’t restricted to just one approach.
In this lesson we will discuss the basic concepts of support and resistance from both a fundamental and technical perspective.
What is Forex Support and Resistance?
Support and resistance in the Forex market is best explained using the concept of supply and demand as well as human psychology. Let’s first take a look at the fundamental side of support and resistance as it relates to the Forex market.
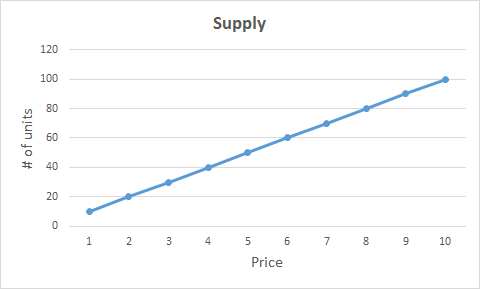
Supply
Any resistance level in the Forex market starts with an increase in supply. In other words, sellers who feel that the current price is at a premium and wish to sell in hopes for a lower future price.
Notice how the number of units available increases as price goes up in the chart below. This illustration of supply represents the most basic element of a resistance level in the Forex market.
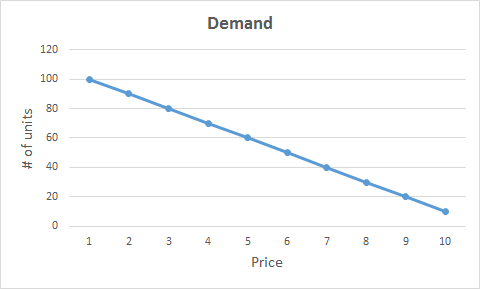
Demand
Any support level in the Forex market starts with an increase in demand. In other words, buyers who feel that the current price is at a discount and wish to buy in hopes for a higher future price.
Notice how the number of units available decreases as price goes up in the chart below. This illustration of demand represents the most basic element of a support level in the Forex market.
So what does supply and demand look like when drawn on a simple price chart?
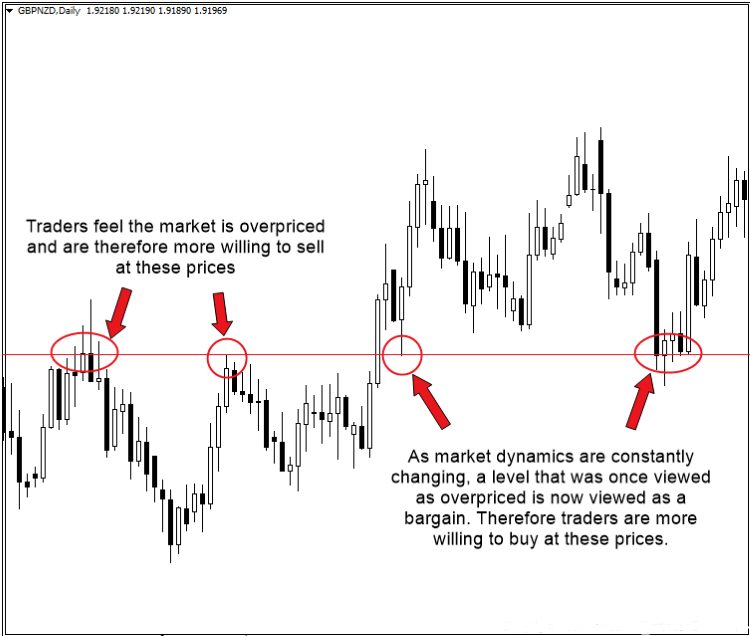
As you can see from the chart above, we have a very well-defined Forex support and resistance level by which we trade from. This is how we can use the concept of supply and demand to our advantage as price action traders.
The Psychology Behind Support and Resistance
There are two sides to a coin, and the topic of Forex support and resistance is no exception. There is the fundamental approach, which we covered above using the concept of supply and demand. Then there is the technical approach, which is my preferred method of using Forex support and resistance levels.
The technical approach to support and resistance simply says that if enough traders see the same level in the market, then that level is likely to be respected. This is why I always say that the more obvious a support or resistance level is, the more conducive it is to an effective trade setup.
You may be thinking that this sounds a bit like a self-fulfilling prophecy, in that we (as traders) see a support or resistance level and therefore expect a reaction. Thus giving life to that very outcome. And you would be absolutely correct in thinking about the technical elements behind support and resistance in this way.
Let’s take another look at the GBPNZD chart above, but this time we’ll examine the level from a technical standpoint.
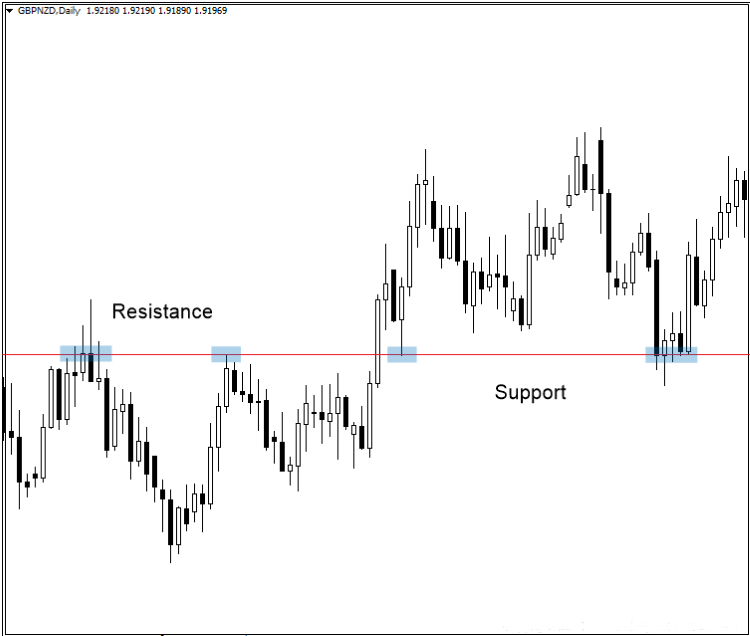
As soon as the resistance level formed from the two swing highs, a technical trader should expect that level to now hold as support. Of course we always want to see a price action signal as confirmation, but the general idea is that a broken resistance level becomes new support. We can therefore use that new support level as the foundation for a potential trade setup.