
So what is a Japanese candlestick?
In order to understand the term “Japanese candlestick”, we need to go back to the 17th century when the Japanese were using technical analysis to trade rice. Yes, technical analysis is that old! The history of the Japanese candlestick is a bit of a mystery and is mostly left to stories, but we do know that much of the credit belongs to a legendary rice trader by the name of Homma from the town of Sakata. His original ideas and concepts have no doubt been modified since then, but his early development of the candlestick pattern laid the path for further refinement.
 The Japanese candlestick techniques made popular by Homma later made their way to the US around 1850, where technical analysis and price action were further developed by Charles Dow. You may recognize the name. Charles Henry Dow founded the Wall Street Journal and later invented the Dow Jones Industrial Average as part of his ongoing market research as it relates to price action. You read that correctly, the founder of both the Wall Street Journal and the Dow Jones Industrial Average was adamant about Japanese candlesticks and price action. So much for price action being some form of “hocus pocus” as some fundamental traders have claimed.
The Anatomy of a Japanese Candlestick
Now that we have a better understanding of how the Japanese candlestick was developed and where it came from, let’s discuss what it is and how we can use it to trade price action. However, before we can use the pattern to trade price action, we need to understand the anatomy of the Japanese candlestick…what makes it “tick”.
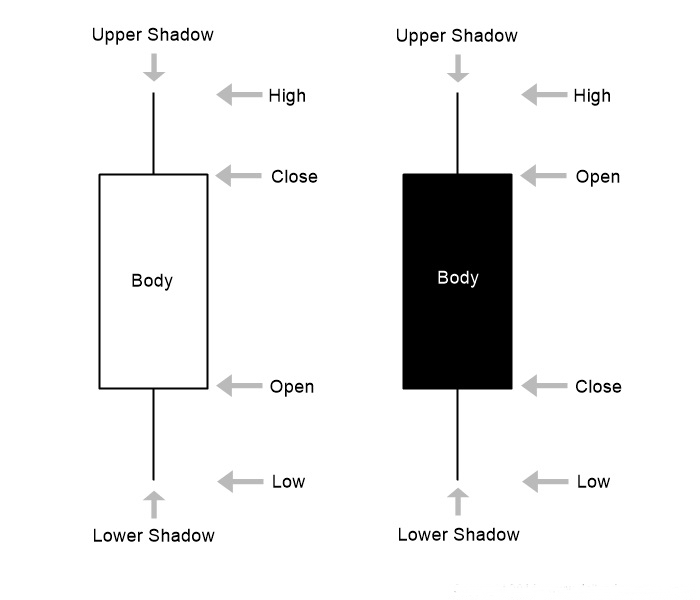 Notice that the only real difference between the two is that the open and close are opposite. This is because the one on the left with the hollow body is considered a bullish Japanese candlestick, where it closed higher than it opened. Whereas the one on the left is considered a bearish Japanese candlestick, in which it closed lower than it opened. The shadow is also sometimes called a “wick”.
Here’s the Japanese candlestick in action on the daily time frame. As you review the chart below, try to piece together the different parts of the candlestick (high, low, open and close). Follow each one from left to right across the chart.
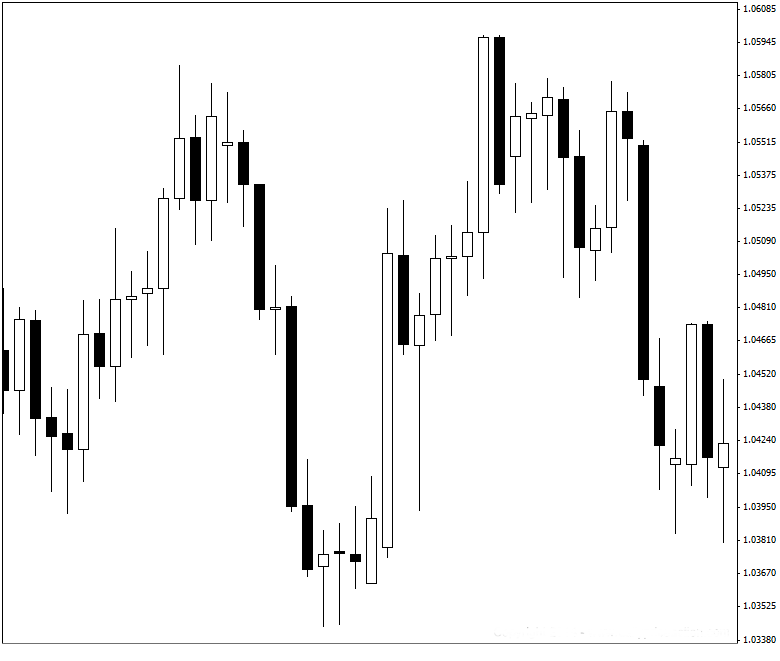
If you’ll notice, the market doesn’t always open exactly where it closed. This happens quite often, especially on a daily chart like the one above when the market opens on Sunday.
This is because there are events which occur over the weekend that can effect price to where it may not open exactly where it closed on Friday. These are called “gaps”. Sometimes these gaps are small, sometimes as large as 100 pips or more. For this reason, many Forex traders will avoid holding positions over the weekend.
Japanese candlesticks can be used for any time frame. The chart above is the daily time frame, but the anatomy of the candlestick doesn’t change whether it be a daily chart, four hour, one hour, you name it.
That about wraps up this lesson on Japanese candlesticks. I hope you’re moving on from this lesson feeling better about reading candlesticks and how you can use them as a price action indicator.